Pet Poisoning Claims Are Up More Than 30% Since 2020
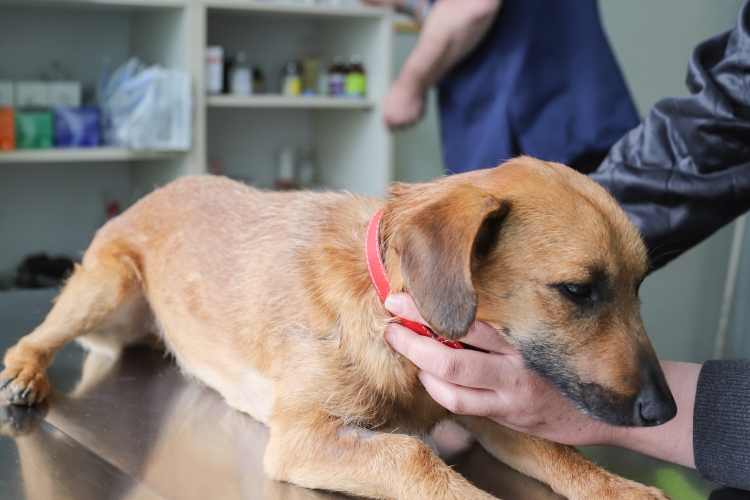
From chocolate and grapes to fertilizer and gum, pets have a habit of getting into things that may be poisonous to them.
Our team at pet medical insurance provider Trupanion, found that the number of poison-related claims among Trupanion insured pets has increased by 30% in dogs and 50% in cats since 2020.
Key Findings
- Trupanion has received more than 71,000 poison-related claims since 2020
- Grapes and raisins are the most common source of poison-related claims
- The cost of poison-related claims ranged from $558 for onions to $1,705 for anti-freeze and detergents
The 10 Most Common Pet Poisons in the United States
Grapes and raisins are the most commonly identified source of poison-related claims among Trupanion pets, with more than 11,000 instances since 2020. Chocolate is the second leading cause of pet poisonings, followed by drugs/medications, rodenticides, various types of plants and xylitol.
Below is a look at the ten most common pet poisons and the average cost of treatment across the United States. The drugs/medication category includes both human and veterinary drugs/medications.
Learn more about how Trupanion pet medical insurance can protect your pet from accidental poisonings and other unexpected events.| Most Common Pet Poisons in the United States | ||
|---|---|---|
Poison | Claims Since 2020 | Average Cost of Treatment |
Grapes/Raisins | 11,588 | $847 |
Chocolate | 6,186 | $865 |
Drugs/Medication | 6,086 | $1,386 |
Rodenticides | 2,985 | $737 |
Plants | 2,638 | $1,219 |
Xylitol (Gum) | 2,330 | $1,396 |
Food - other (includes alcohol, caffeine and mushrooms*) | 1,134 | $863 |
Cannabis | 1,129 | $880 |
Onion (Allium) | 548 | $558 |
Insecticide | 135 | $1,117 |
The Ten Most Common Pet Poisons in Canada
Just like in the United States grapes and raisins are the most common identified source of poison-related claims in Canada. However, when we look at the ten most common poisons in Canada, there are some differences from the US. For example, poisonings from plants and cannabis are more common in Canada (4th and 5th respectively), while poisonings from rodenticides and xylitol are less common.
The average cost of treatment is represented in Canadian currency.
| Most Common Pet Poisons in Canada | ||
|---|---|---|
Poison | Claims Since 2020 | Average Cost of Treatment |
Grapes/Raisins | 5,870 | $738 |
Chocolate | 3,418 | $707 |
Drugs/Medication | 2,422 | $1,194 |
Plants | 1,908 | $1,007 |
Cannabis | 1,345 | $644 |
Rodenticides | 1,095 | $573 |
Xylitol (Gum) | 859 | $1,338 |
Onion (Allium) | 374 | $445 |
Food - other (includes alcohol, caffeine and mushrooms*) | 286 | $766 |
Fertilizer | 19 | $421 |
Pet Poisonings in Each State
The number of poison-related claims in each state varies significantly depending on the population of the state. California, the most populous state, had the most claims overall with 8,206. Wyoming, the least populous state, had the fewest number of claims with 22.
Louisiana had the highest rate of poison-related claims with 1.75 claims per 1,000 pets. Followed by Utah (1.59), Maine (1.58), South Dakota (1.50) and Colorado (1.37).
Arkansas had the lowest rate of poison-related claims with .65 claims per 1,000 pets. Followed by West Virginia (.68), Wyoming (.73), Rhode Island (0.73) and Iowa (.75).
| Poisoning Claims in Each State | |||
|---|---|---|---|
State | Dog Claims | Cat Claims | Total Claims |
Alabama | 236 | 9 | 245 |
Alaska | 177 | 15 | 192 |
Arizona | 492 | 32 | 524 |
Arkansas | 62 | 11 | 73 |
California | 7,755 | 451 | 8,206 |
Colorado | 1,589 | 113 | 1,702 |
Connecticut | 1,385 | 59 | 1,444 |
Delaware | 70 | 6 | 76 |
Florida | 3,352 | 149 | 3,501 |
Georgia | 802 | 58 | 860 |
Hawaii | 437 | 15 | 452 |
Idaho | 178 | 15 | 193 |
Illinois | 1,060 | 84 | 1,144 |
Indiana | 362 | 40 | 402 |
Iowa | 174 | 13 | 187 |
Kansas | 209 | 16 | 225 |
Kentucky | 168 | 19 | 187 |
Louisana | 667 | 17 | 684 |
Maine | 618 | 44 | 662 |
Maryland | 587 | 41 | 628 |
Massachusetts | 4,424 | 271 | 4,695 |
Michigan | 478 | 46 | 524 |
Minnesota | 483 | 40 | 523 |
Mississippi | 60 | 2 | 62 |
Missouri | 301 | 40 | 341 |
Montana | 109 | 8 | 117 |
Nebraska | 135 | 6 | 141 |
Nevada | 817 | 40 | 857 |
New Hampshire | 651 | 50 | 701 |
New Jersey | 2,450 | 155 | 2,605 |
New Mexico | 132 | 12 | 144 |
New York | 3,351 | 188 | 3,539 |
North Carolina | 1,335 | 81 | 1,416 |
North Dakota | 42 | 2 | 44 |
Ohio | 470 | 46 | 516 |
Oklahoma | 118 | 9 | 127 |
Oregon | 1,079 | 90 | 1,169 |
Pennsylvania | 874 | 81 | 955 |
Rhode Island | 202 | 13 | 215 |
South Carolina | 427 | 24 | 451 |
South Dakota | 39 | 0 | 39 |
Tennessee | 498 | 36 | 534 |
Texas | 1,514 | 112 | 1,626 |
Utah | 409 | 22 | 431 |
Vermont | 1,144 | 10 | 1,154 |
Virginia | 157 | 81 | 238 |
Washington | 2,957 | 259 | 3,216 |
West Virginia | 35 | 2 | 37 |
Wisconsin | 311 | 29 | 340 |
Wyoming | 19 | 3 | 22 |
Pet Poisonings in Each Province
The number of poison-related claims in Canadian provinces varies from 7,222 in Ontario to 269 in Manitoba. Prince Edward had the highest rate of poison-related claims at 2.02 per 1,000 pets. Quebec had the lowest rate of any province with more than 250 poison-related claims at .94 claims per 1,000 pets.
| Poisoning Claims in Each Province | |||
|---|---|---|---|
Province | Cat Claim Count | Dog Claim Count | Total Claim Amount |
Alberta | 4,234 | 410 | 4,644 |
British Columbia | 4,119 | 384 | 4,503 |
Manitoba | 245 | 24 | 269 |
New Brunswick | 809 | 33 | 842 |
Newfoundland & Labrador | 1,385 | 94 | 1,479 |
Nova Scotia | 1,509 | 114 | 1,623 |
Ontario | 6,639 | 583 | 7,222 |
Prince Edward | 274 | 27 | 301 |
Quebec | 958 | 93 | 1,051 |
Saskatchewan | 281 | 34 | 315 |
The Most Common Pet Poisons Statewide
Grapes, chocolate and drugs/medications are the most common identified sources of pet poisoning, but there are some differences when we look at the most common pet poisons on a state level.
For example, rodenticides are a common source of poison-related claims in Arizona but not in Washington. Georgia, meanwhile, is the only state where alcohol and caffeine are among the top sources of pet poisonings.
The Most Common Pet Poisons in Arizona
- Grapes/Raisins
- Drugs/Medications
- Rodenticides
- Chocolate
- Plants
The Most Common Pet Poisons in California
- Grapes/Raisins
- Chocolate
- Drugs/Medications
- Plants
- Rodenticides
The Most Common Pet Poisons in Colorado
- Grapes/Raisins
- Drugs/Medications
- Chocolate
- Rodenticides
- Plants
The Most Common Pet Poisons in Florida
- Grapes/Raisins
- Chocolate
- Drugs/Medications
- Plants
- Xylitol/Gum
The Most Common Pet Poisons in Georgia
- Grapes/Raisins
- Chocolate
- Drugs/Medications
- Plants
- Alcohol and Caffeine
The Most Common Pet Poisons in Illinois
- Grapes/Raisins
- Chocolate
- Drugs/Medications
- Plants
- Rodenticides
The Most Common Pet Poisons in Indiana
- Grapes/Raisins
- Drugs/Medications
- Chocolate
- Xylitol/Gum
- Rodenticides
The Most Common Pet Poisons in Massachusetts
- Grapes/Raisins
- Chocolate
- Drugs/Medications
- Plants
- Rodenticides
The Most Common Pet Poisons in New York
- Grapes/Raisins
- Chocolate
- Drugs/Medications
- Plants
- Rodenticides
The Most Common Pet Poisons in North Carolina
- Grapes/Raisins
- Drugs/Medications
- Chocolate
- Rodenticides
- Xylitol/Gum
The Most Common Pet Poisons in Ohio
- Grapes/Raisins
- Drugs/Medications
- Chocolate
- Xylitol/Gum
- Rodenticides
The Most Common Pet Poisons in Pennsylvania
- Grapes/Raisins
- Drugs/Medications
- Chocolate
- Rodenticides
- Plants
The Most Common Pet Poisons in Texas
- Grapes/Raisins
- Chocolate
- Drugs/Medications
- Plants
- Rodenticides
The Most Common Pet Poisons in Washington
- Grapes/Raisins
- Drugs/Medications
- Chocolate
- Plants
- Xylitol/Gum
Signs of Poisoning in Cats and Dogs
Different types of poison will have different effects in pets but there are some common signs to look out for.
Signs of Poisoning in Cats
- Vomiting
- Diarrhea
- Difficulty breathing
- Skin inflammation or sweliing
- Unsteady gait
- Tremors and/or seizures
Signs of Poisoning in Dogs
- Vomiting
- Diarrhea
- Tremors and/or seizures
- Pale or discolored gums
- Unsteady gait
Methodology
Trupanion looked at the number of poison-related claims from January 2020 – December 2025. Claims are broken down nationally (United States and Canada), by state and by province.
It is important to note that while claim counts and rates can provide insight into insured pet activity, fluctuations in these figures may be influenced by evolving clinical practices and various external factors, rather than representing a definitive shift in toxicant ingestion. Further investigation into the environmental and behavioral variables is warranted to confirm the primary drivers behind these data trends.
The “food-other” category is comprised of various types of food-related poisons, including alcohol, caffeine, mushrooms, macadamia and zinc.
